A quick reference gallery for what the most broadly useful functions do.
Loading and pre-processing images
readImage: Reads in a PNG or JPEG image, optionally resizing and/or rotating it.
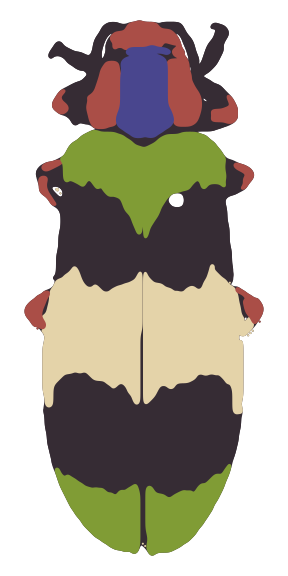
img <- system.file("extdata/corbetti.png", package = "recolorize")
loaded_image <- readImage(img_path = img, resize = NULL, rotate = NULL)
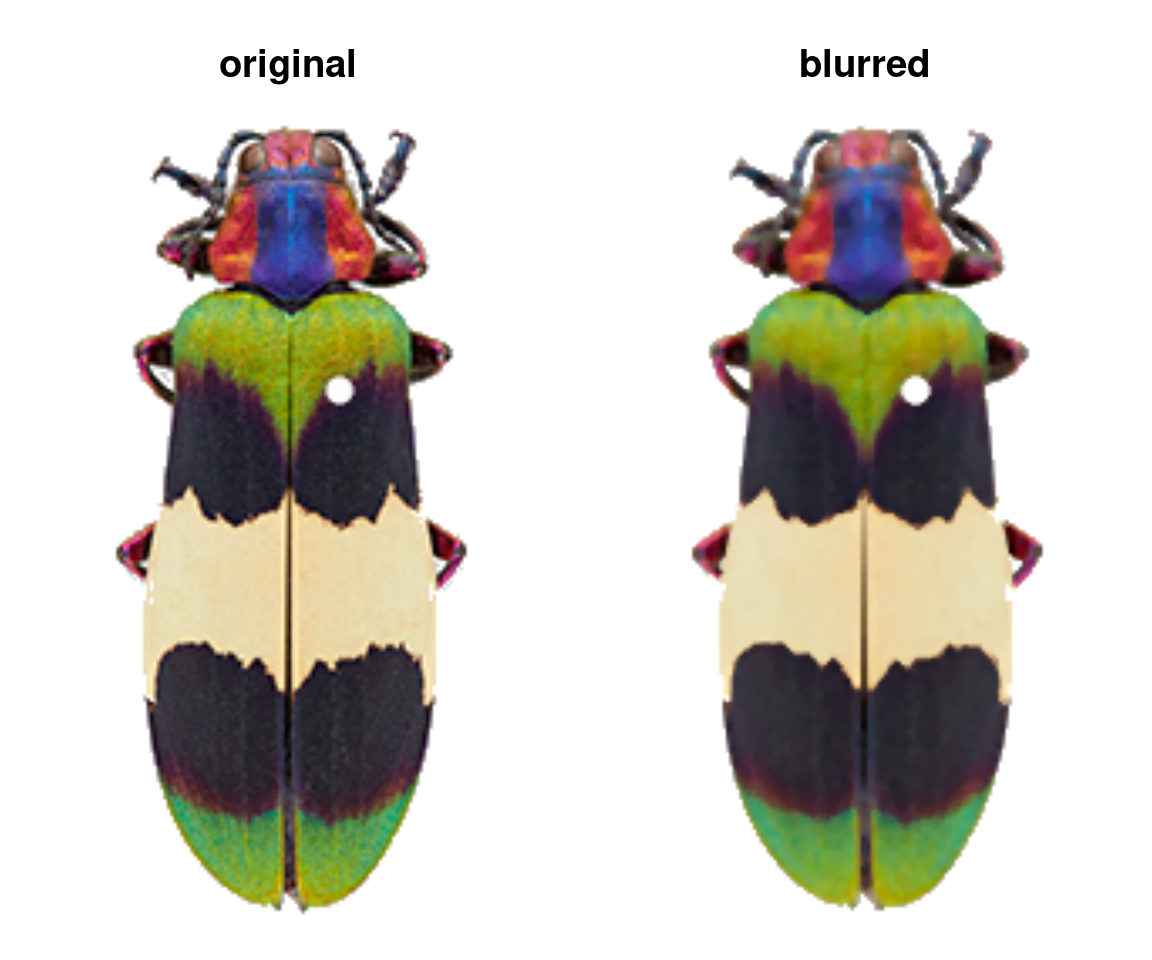
blurImage: Applies one of several blurring filters from theimagerpackage to a loaded image. Helpful for dealing with variation from textures (e.g. scales, reflections, hairs, etc).
blurred_image <- blurImage(loaded_image, blur_function = "medianblur", n = 3, threshold = 5)
Initial segmentation
recolorize: The major function of the package. Segments colors using color binning (method = "hist") or k-means clustering (method = "k"), in several color spaces.
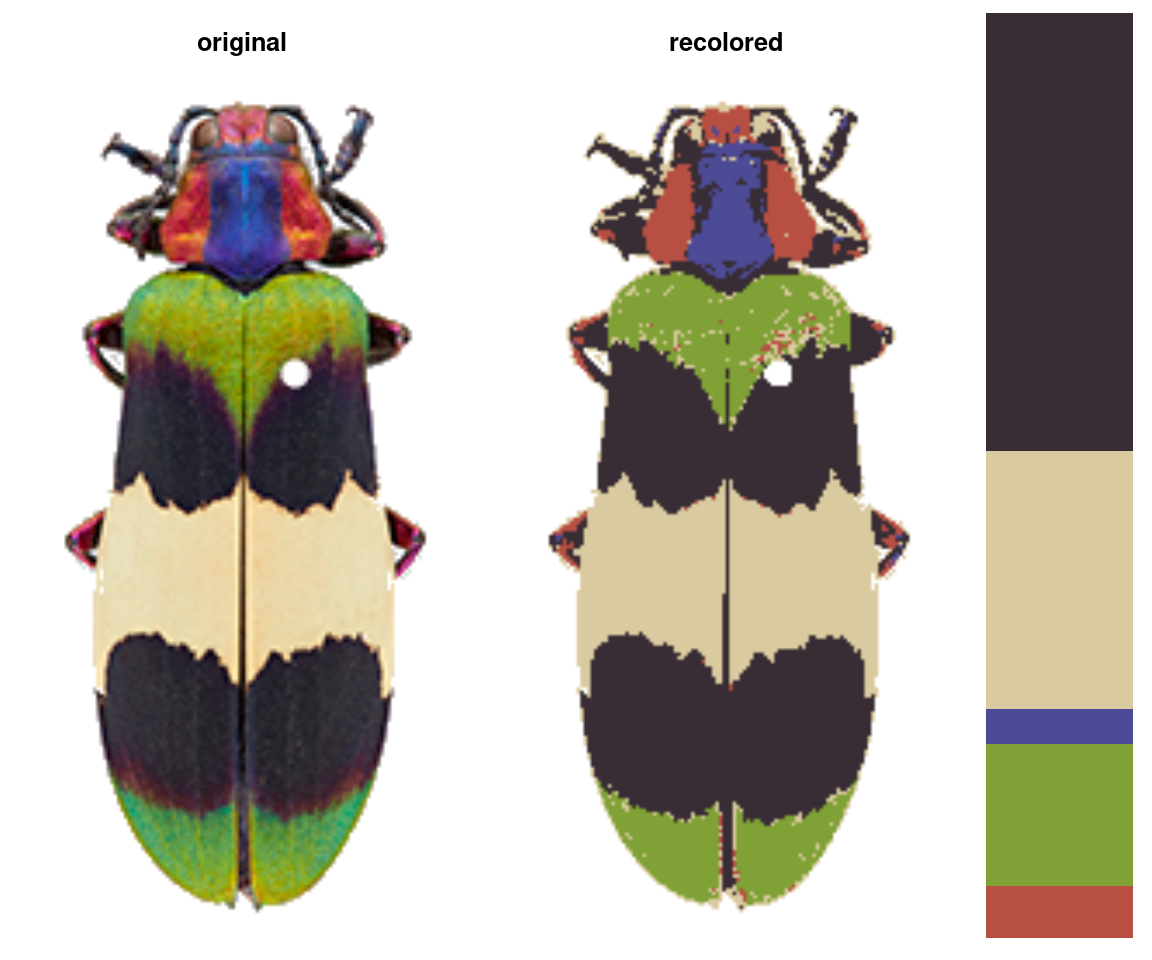
rc_hist <- recolorize(img, method = "hist", bins = 2, color_space = "sRGB")
#>
#> Using 2^3 = 8 total bins
rc_k <- recolorize(img, method = "k", n = 8, color_space = "sRGB")
recolorize2: Runsrecolorizeandrecluster(see next section) in sequence. I have found this to be an effective, fast combination for very many kinds of images, so if you’re going to pick one function to start with, pick this one!
rc <- recolorize2(img, cutoff = 45)
#>
#> Using 2^3 = 8 total bins


imposeColors: Imposes colors from one image onto another image (useful for batch processing).
colors <- c("tomato",
            "limegreen",
            "dodgerblue",
            "cornsilk",
            "black")
colors <- t(col2rgb(colors)) / 255
imposed <- imposeColors(img, centers = colors)
Refining initial results
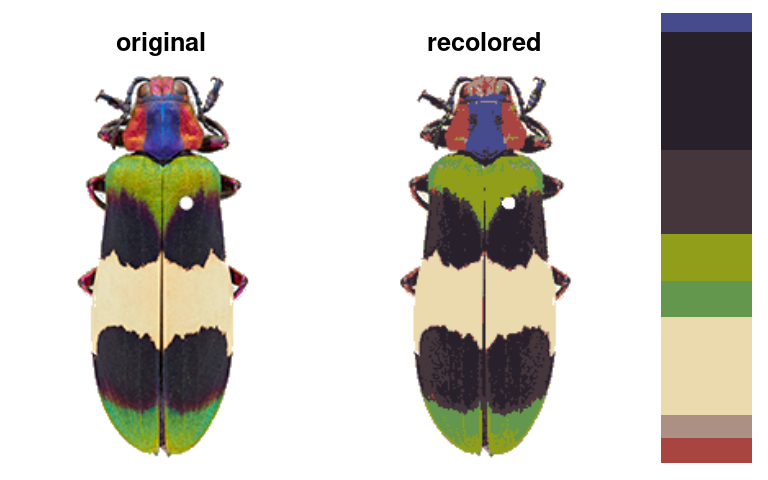
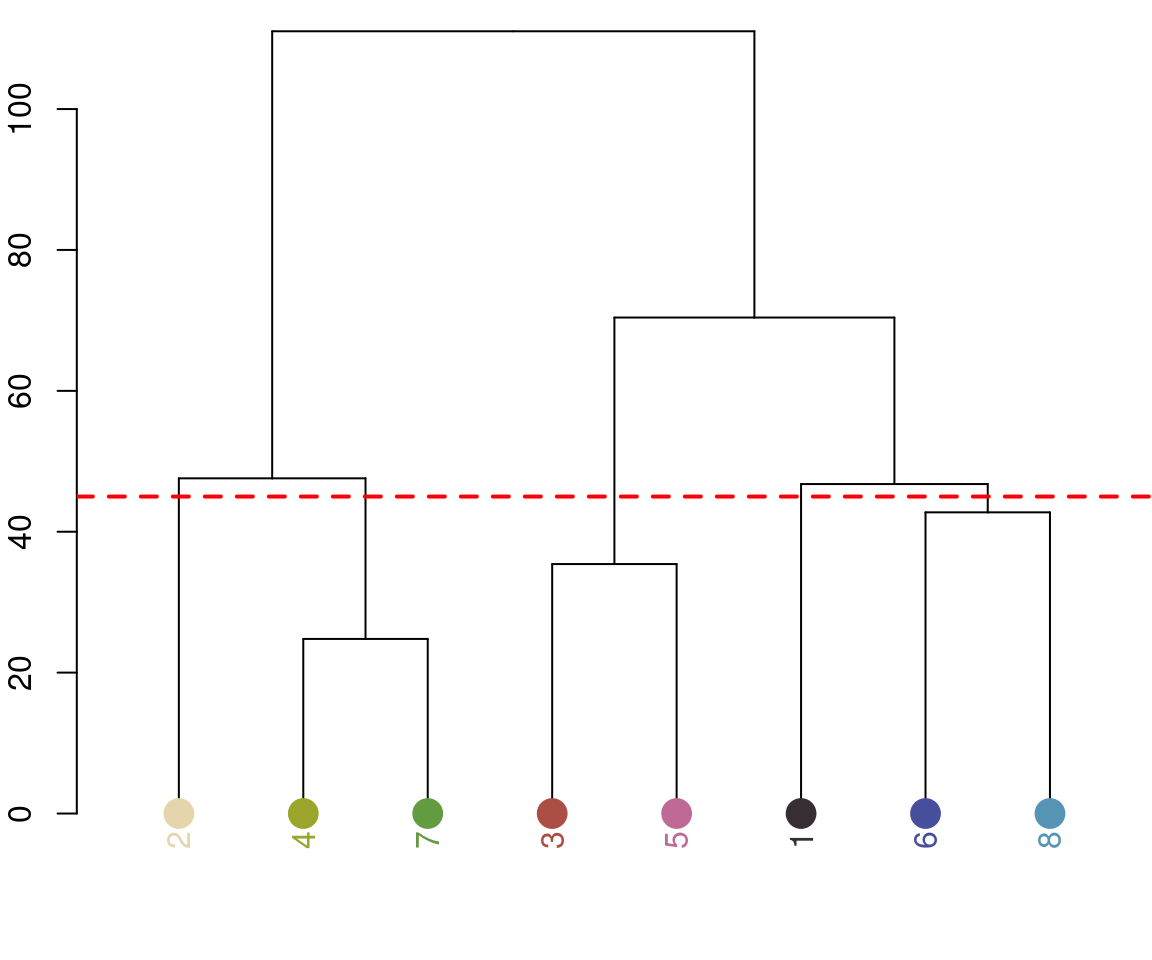
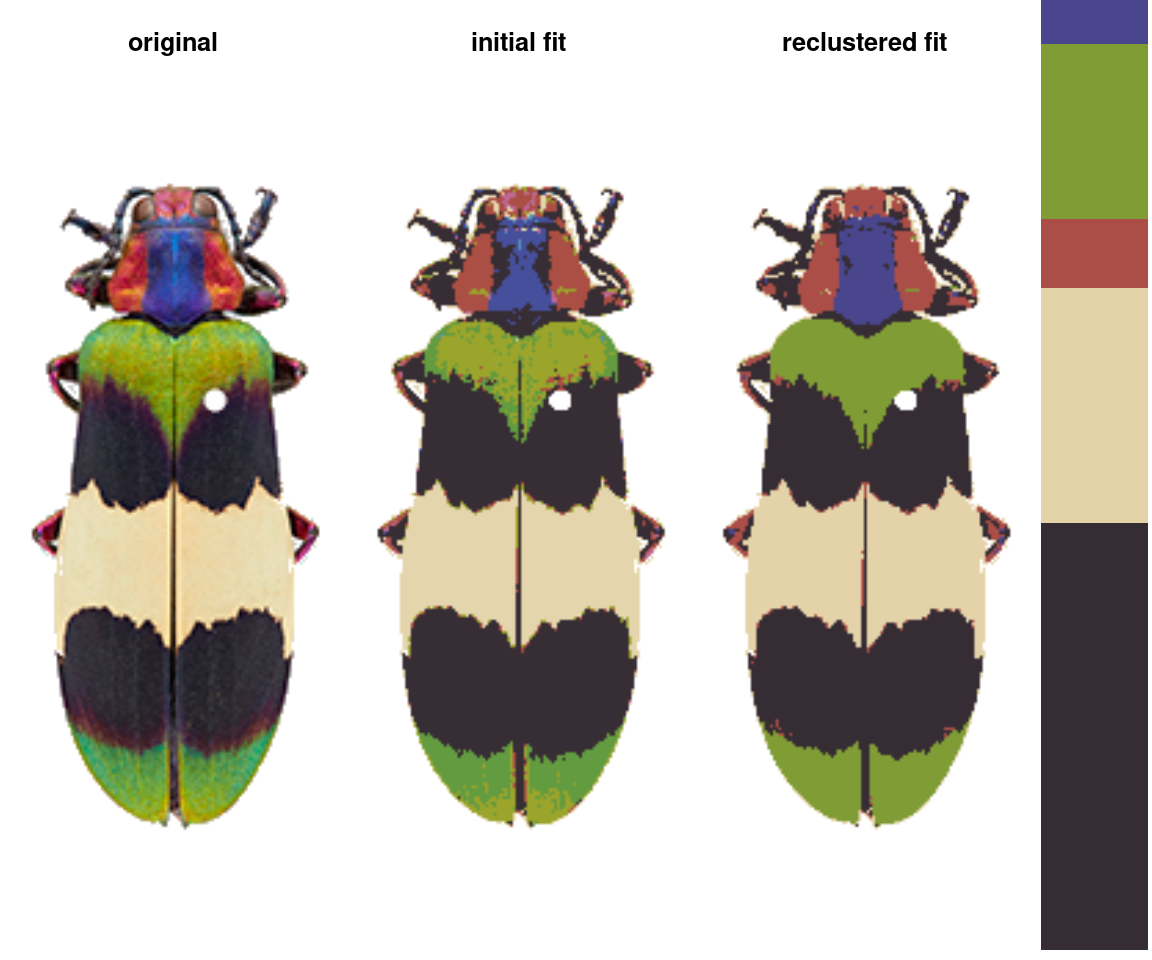
recluster: Combines existing clusters based on either a cutoff for color similarity or a target number of colors.
recluster_fit <- recluster(rc_hist, similarity_cutoff = 45)
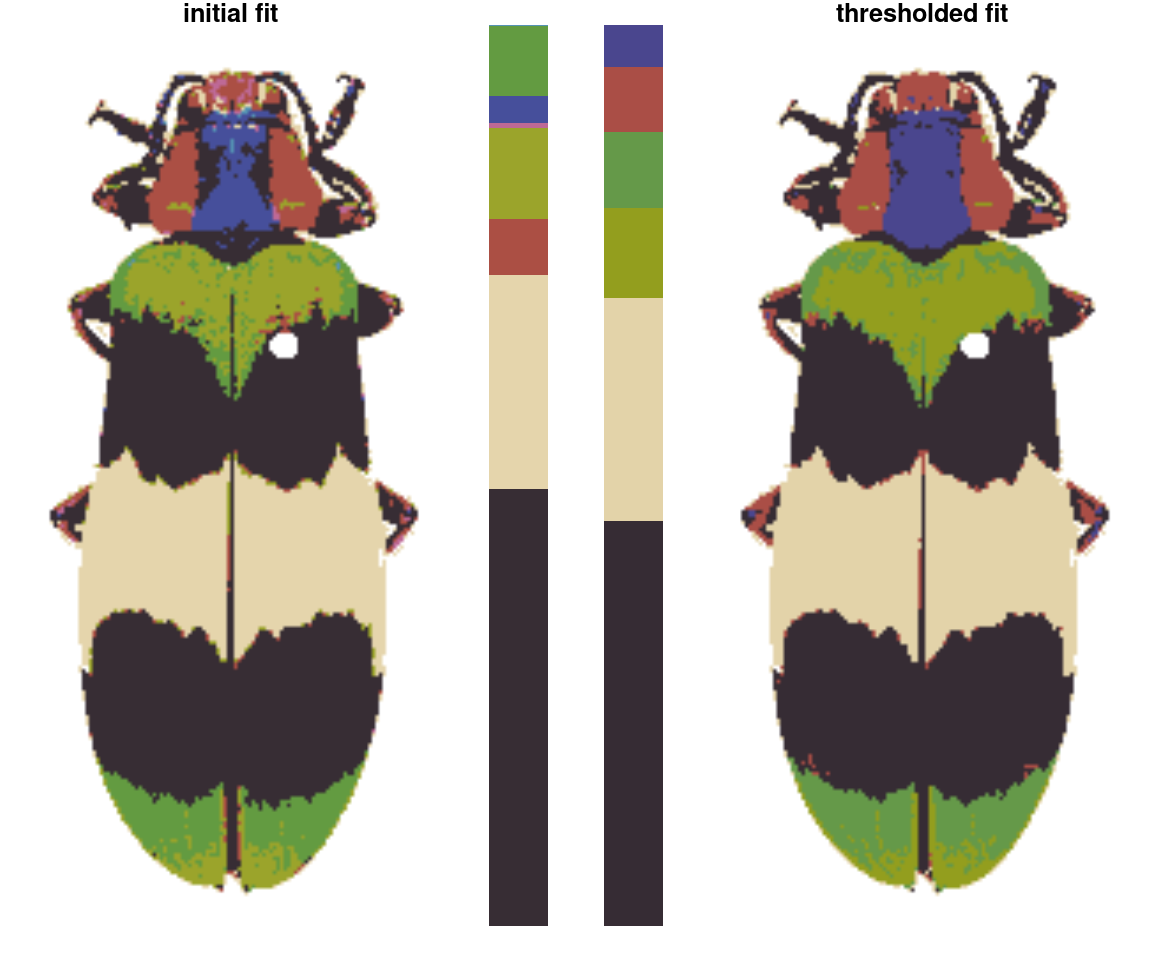
thresholdRecolor: Drops the smallest clusters from arecolorizefit and refits the original image.
rc_thresh <- thresholdRecolor(rc_hist, pct = 0.01)
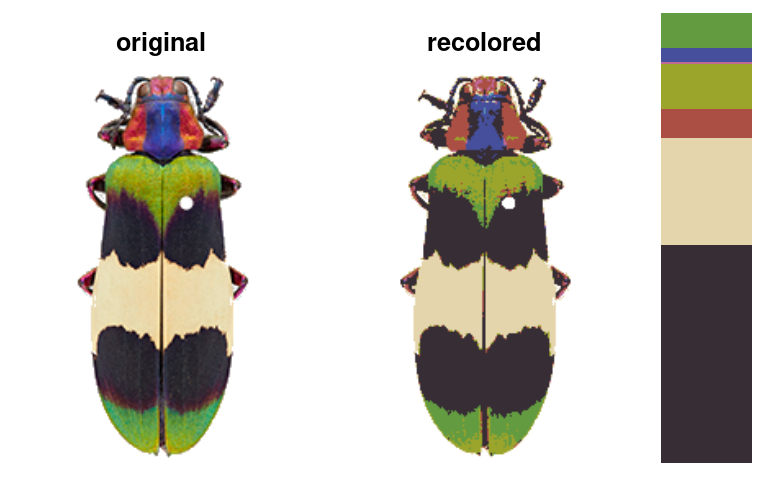
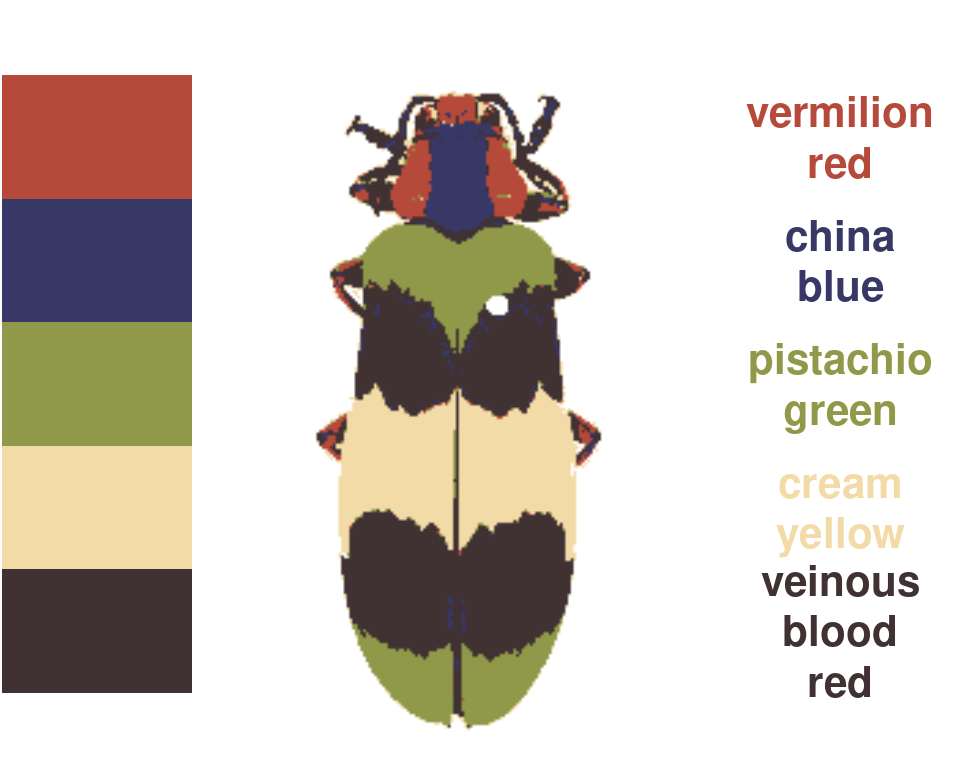
wernerColor: Remaps a recolorize object to the colors in Werner’s Nomenclature of Colors by Patrick Syme (1821), one of the first attempts at an objective color reference in western science, notably used by Charles Darwin. This one is mostly just for fun.
rc_werner <- wernerColor(recluster_fit)
Minor edits
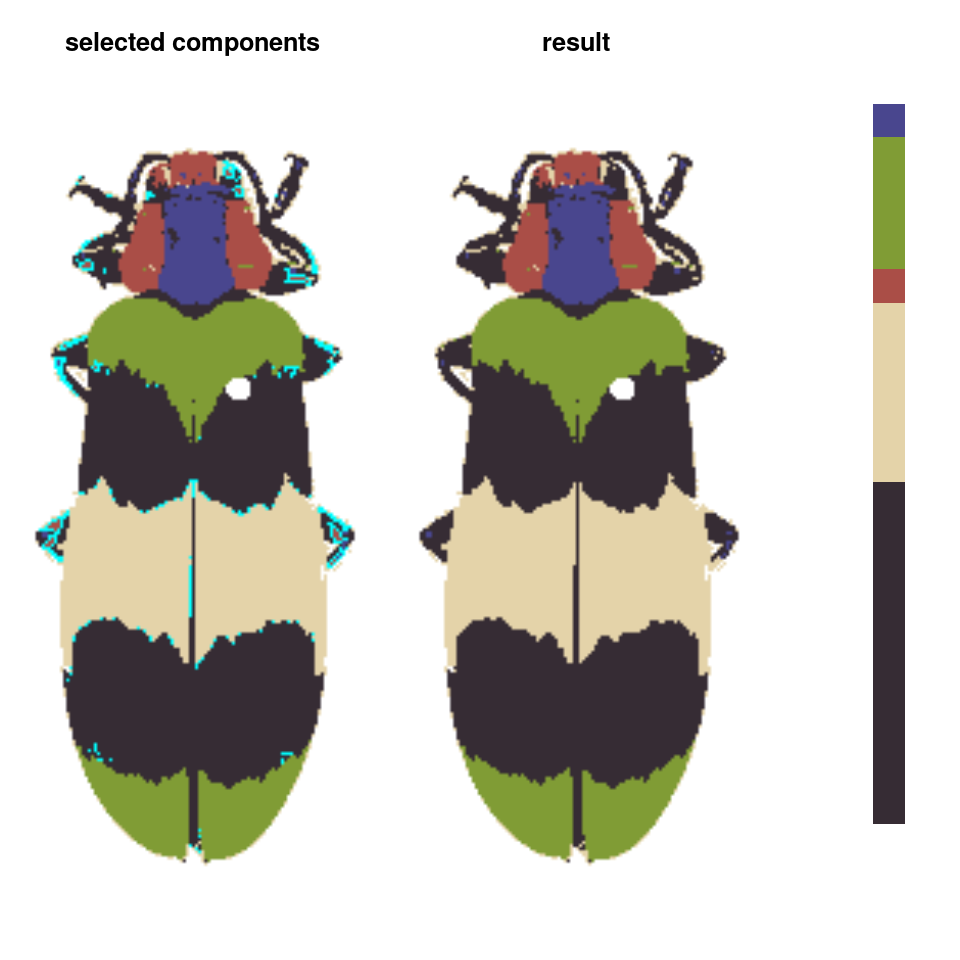
absorbLayer: “Absorbs” all or part of a layer into the surrounding colors, optionally according to a size or location condition.
absorb_red <- absorbLayer(recluster_fit,
                          layer_idx = 3,
                          size_condition = function(s) s <= 100,
                          highlight_color = "cyan")
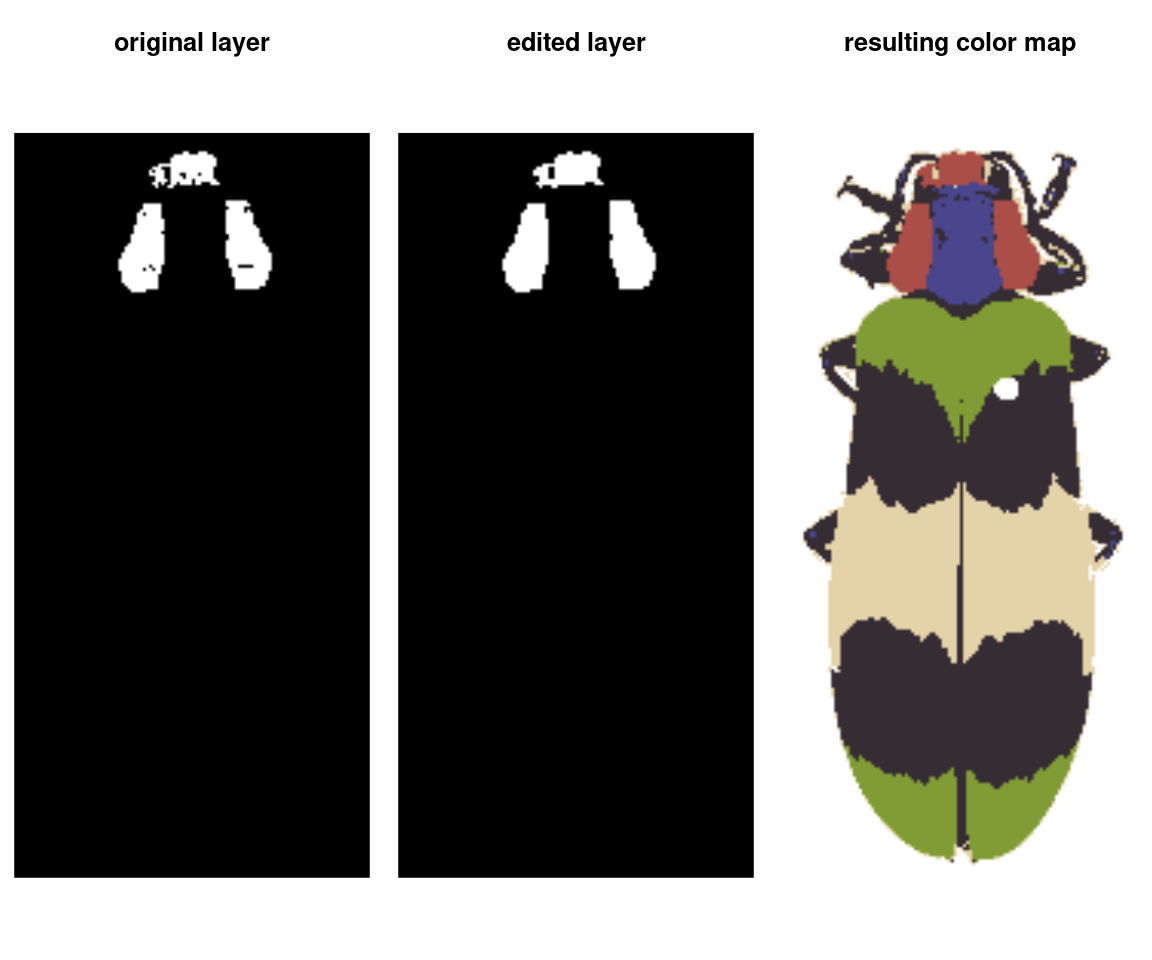
editLayer/editLayers: Applies one of several morphological operations fromimagerto a layer (or layers) of arecolorizeobject. This can be used to despeckle, fill in holes, or uniformly grow or shrink a color patch.
rc_edit <- editLayer(absorb_red,
                      layer_idx = 3,
                      operation = "fill",
                      px_size = 2)
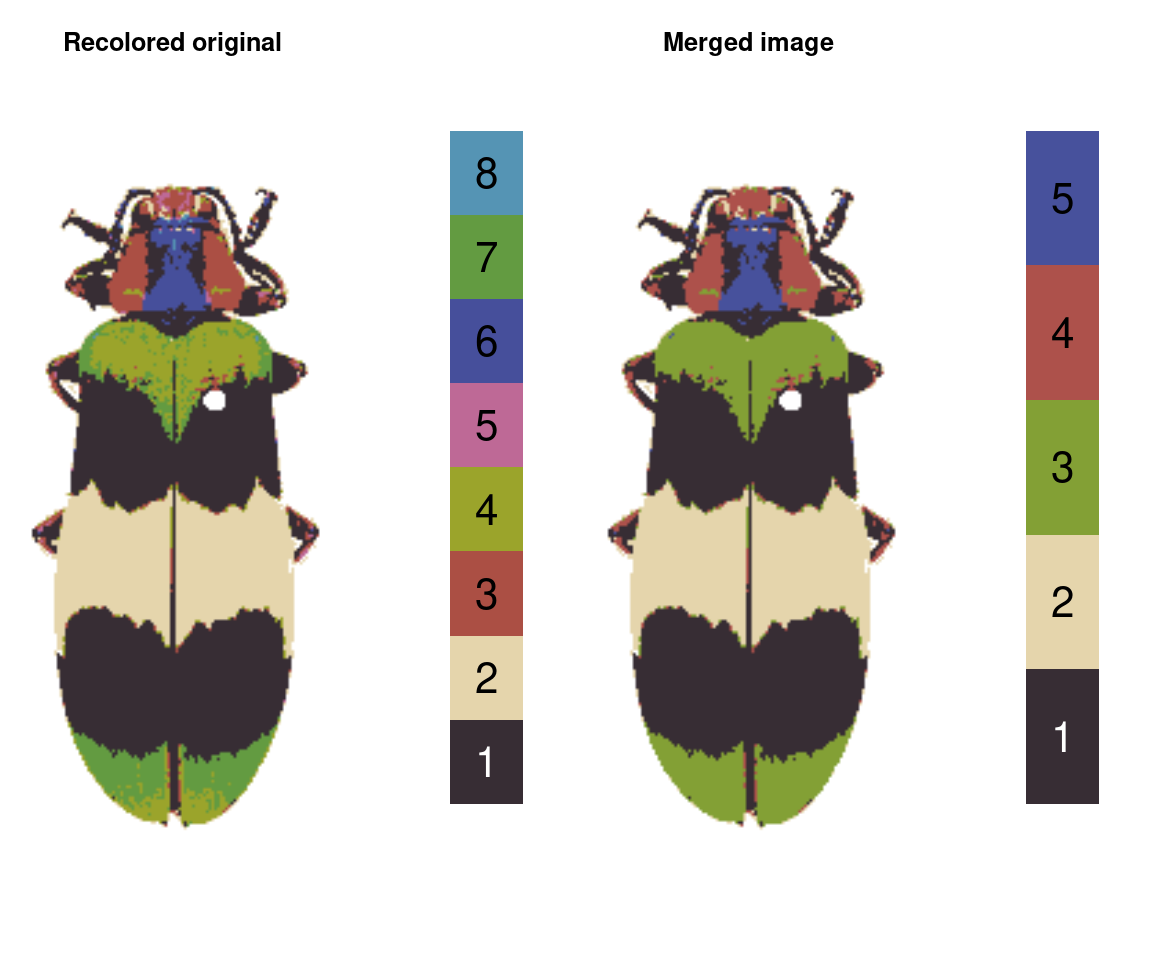
mergeLayers: Merges specified layers together, with options for setting the new color.
merged_rc <- mergeLayers(rc_hist, merge_list = list(c(4, 7),
                                                    c(3, 5),
                                                    c(6, 8)))
Visualization
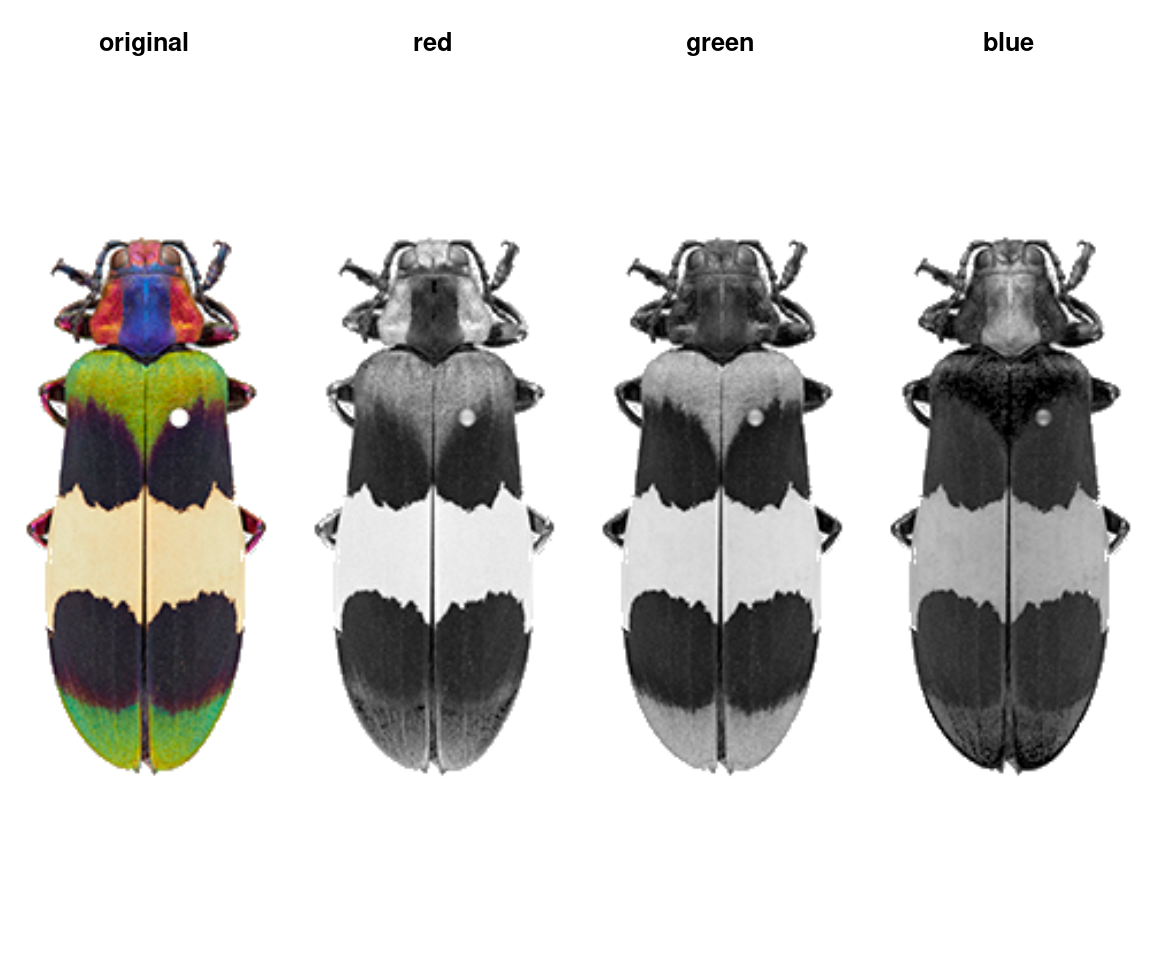
plotImageArray: Plots a 1D or 3D array as an RGB image.
layout(matrix(1:4, nrow = 1))
plotImageArray(loaded_image, main = "original")
plotImageArray(loaded_image[ , , 1], main = "red")
plotImageArray(loaded_image[ , , 2], main = "green")
plotImageArray(loaded_image[ , , 3], main = "blue")
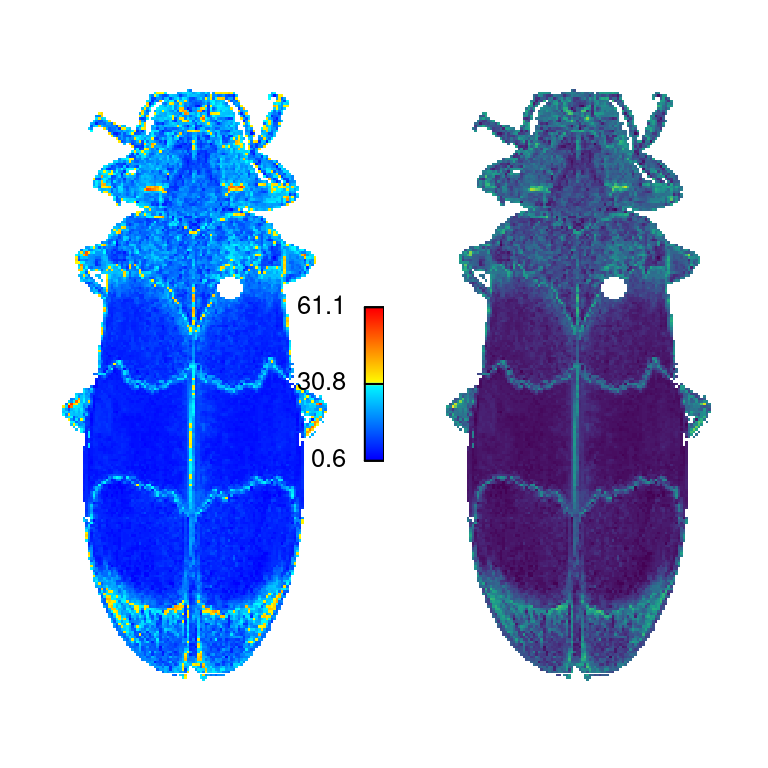
imDist|imHeatmap: Compares two versions of the same image by calculating the color distance between the colors of each pair of pixels (imDist), and gives you a few more options for plotting the results (imHeatmap).
layout(matrix(1:2, nrow = 1))
par(mar = rep(0, 4))
im_dist <- imDist(im1 = raster_to_array(recluster_fit$original_img),
                  im2 = recoloredImage(recluster_fit), color_space = "Lab")
imHeatmap(im_dist, palette = viridisLite::viridis(100),
          legend = FALSE)
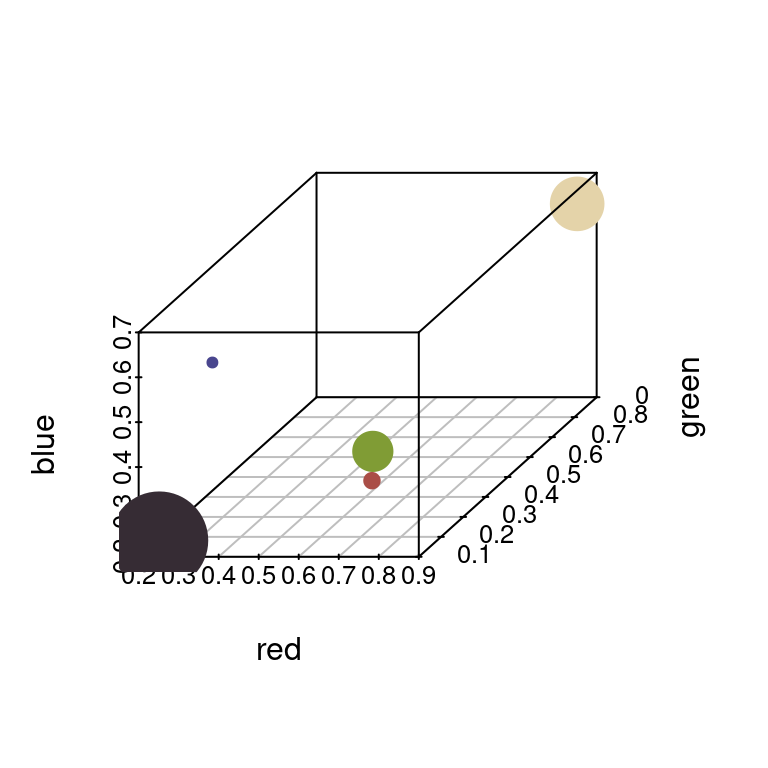
plotColorClusters: Plots color clusters in a 3D color space.
par(mar = rep(1, 4))
plotColorClusters(recluster_fit$centers,
                  recluster_fit$sizes,
                  color_space = "sRGB",
                  xlab = "red", ylab = "green", zlab = "blue")
plotColorPalette: Alternatively, just plot as a color palette.
par(mar = rep(0, 4))
plotColorPalette(recluster_fit$centers, recluster_fit$sizes)

Exporting to other packages or files
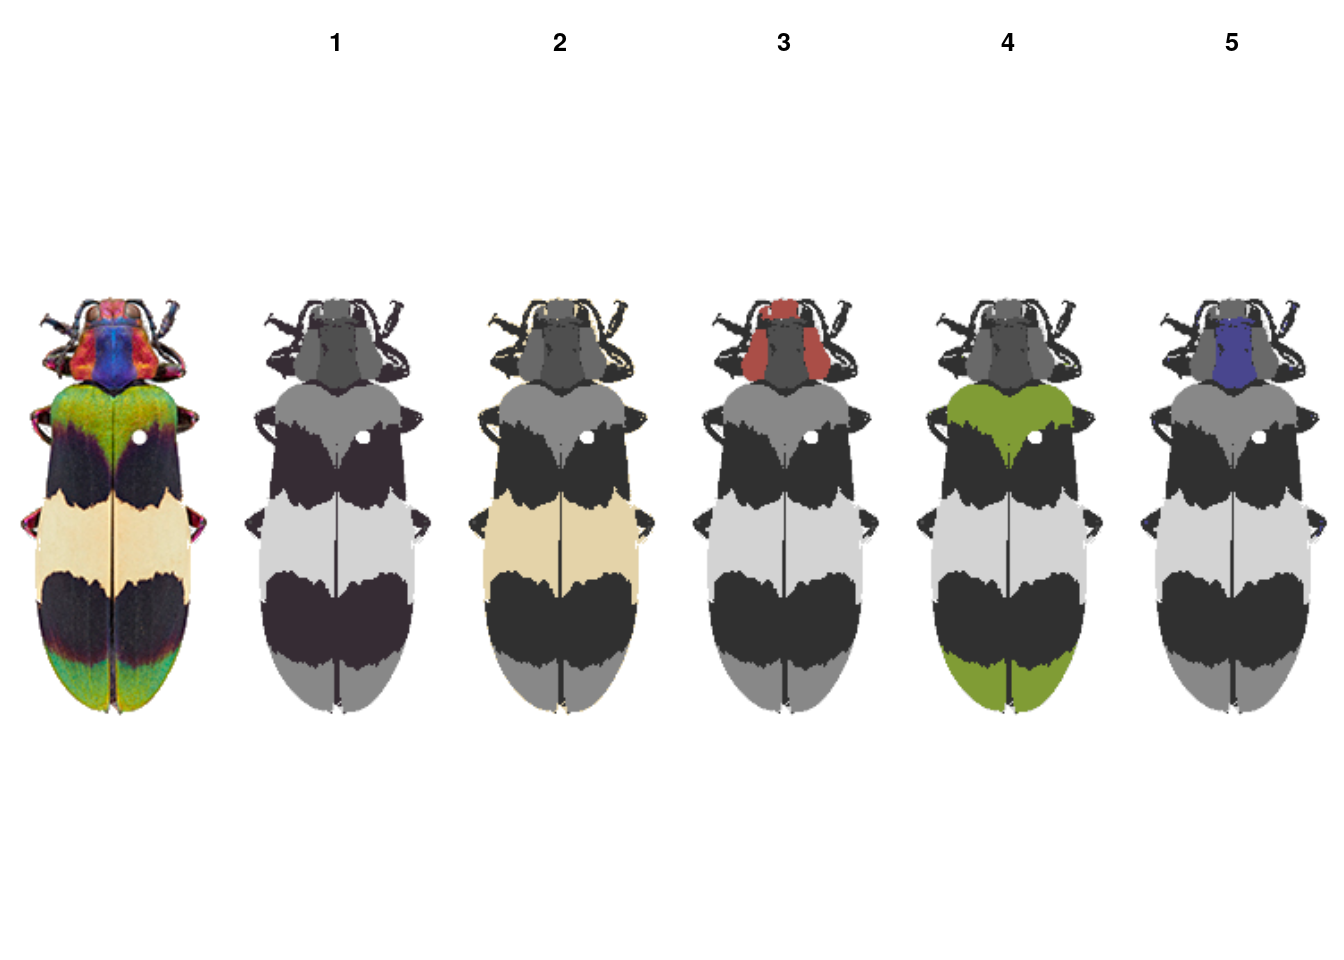
splitByColor: Separates color clusters into individual layers (binary masks).
layout(matrix(1:6, nrow = 1))
plotImageArray(rc_edit$original_img)
corbetti_layers <- splitByColor(rc_edit, plot_method = "over")
classify_recolorize: Converts arecolorizeobject to a classify object in the pavo package for linking with spectral data.recolorize_adjacency: Converts to aclassifyobject using the above function, then runs the adjacency and boundary strength analysis function using values for human perceptual similarity.recolorizeVector: Converts a bitmap (i.e. pixel) image to a vector image.
rc_vector <- recolorizeVector(recluster_fit, size_filter = 0.15, smoothness = 5)