Editing zone maps with user-selected regions
 This is a little excessive for an example, but it gets the point across!
As much as I would like recolorize to provide a single perfect solution to color segmentation that requires no user input, I made it modular for a reason. Supposed “one-click” methods can be really frustrating when they just barely don’t work for your use case and offer no simple way to fix their output.
I know that recolorize will often produce results that are pretty good but not quite right: maybe a part of your image is in deep shadows or a specimen was damaged in preservation. I have certainly had cases where I wanted to open up a recolorize object in ImageJ to just outline a particularly troublesome region of an image, and others using the package have voiced similar suggestions.
With that in mind, I wrote an (experimental) function to allow the user to select a region of the image to alter. This is obviously not as sophisticated as image analysis software with a dedicated user interface, but I think it works really well when you have small fixes to implement, because it means you don’t have to clumsily go between a bunch of different softwares for different things.
I tried to keep this function as lightweight as possible, so it’s not fancy, but maybe it will be useful. Let’s define the function first and then I’ll demonstrate how it works:
library(recolorize)
recolor_selection <- function(rc_obj, color_to = 1,
                       selection = "rect",
                       locator_color = "red",
                       n_polygons = 1,
                       plotting = TRUE,
                       recolor_background = FALSE) {
  # store old map
  rc_original_pix <- rc_obj$pixel_assignments

  # choose region selection method:
  selection <- match.arg(arg = selection, choices = c("rectangle", "polygon"))

  # make image:
  img <- recoloredImage(rc_obj, type = "raster")
  layout(1); par(mar = rep(0, 4))
  plot(img)

  # plot horizontal and vertical bounds to keep user from selecting
  # outside the image boundaries:
  abline(h = c(0, dim(img)[1]), v = c(0, dim(img)[2]), col = "darkgrey")

  # user-select area and change color of pixels inside region of interest
  if (selection == "rectangle") {

    # select a rectangle
    u <- spatstat.geom::clickbox(add = TRUE, col = locator_color)

    # store the input
    u$xrange <- round(u$xrange)
    u$yrange <- round(u$yrange)

    # flip the yrange (in the image, y is numbered bottom to top, but in an array
    # it's indexed top to bottom)
    u$yrange <- dim(img)[1] - u$yrange

    # and change pixel assignments to new color
    rc_obj$pixel_assignments[u$yrange[1]:u$yrange[2],
                             u$xrange[1]:u$xrange[2]] <- color_to

  } else if (selection == "polygon") {

    # select polygon(s)
    u <- spatstat.geom::clickpoly(add = TRUE, col = locator_color, np = n_polygons)
    u$xrange <- round(u$xrange)
    u$yrange <- round(u$yrange)
    u$bdry <- lapply(u$bdry, \(x) lapply(x, round))

    # find all pixels inside of the bounding box for the polygon(s)
    xy <- expand.grid(u$xrange[1]:u$xrange[2], u$yrange[1]:u$yrange[2])

    # for every polygon...
    for (i in 1:length(u$bdry)) {
      pol <- u$bdry[[i]]
      # find which points in the bounding box fall inside the polygon
      if (i == 1) {
        col_idx <- xy[which(secr::pointsInPolygon(xy, do.call(cbind, pol), logical = T)), ]
      } else {
        new_idx <- xy[which(secr::pointsInPolygon(xy, do.call(cbind, pol), logical = T)), ]
        col_idx <- rbind(col_idx, new_idx)
      }
    }

      # reverse x/y order, y
      col_idx <- as.matrix(col_idx[ , 2:1])
      col_idx[,1] <- dim(img)[1] - col_idx[,1]

      # and change color
      rc_obj$pixel_assignments[col_idx] <- color_to

  }

  # make sure the background is still transparent
  if (!recolor_background) {
    rc_obj$pixel_assignments[rc_original_pix == 0] <- 0
  }

  # if plotting, plot
  if (plotting) {

    # draw box or polygon around the region that was changed
    plot_region <- function() {
      xdim <- dim(rc_obj$pixel_assignments)[2]
      ydim <- dim(rc_obj$pixel_assignments)[1]
      if (selection == "rectangle") {
        rect(xleft = u$xrange[1] / xdim, xright = u$xrange[2] / xdim,
             ybottom = 1 - u$yrange[1] / ydim, ytop = 1 - u$yrange[2] / ydim,
             border = locator_color)
      } else {
        for (i in 1:length(u$bdry)) {
          polygon(u$bdry[[i]]$x / xdim,
                  u$bdry[[i]]$y / ydim, border = locator_color)
        }
      }
    }

    # reset graphical parameters when function exits:
    current_par <- graphics::par(no.readonly = TRUE)
    on.exit(graphics::par(current_par))

    # set layout
    graphics::layout(matrix(1:3, nrow = 1),
                     widths = rep(1, 3))

    # plot original image
    graphics::par(mar = c(0, 0, 2, 0))
    recolorize::plotImageArray(rc_obj$original_img,
                               main = "Recolored original")
    plot_region()

    # plot old zone map with polygon/rectangle
    graphics::par(mar = c(0, 0, 2, 0))
    recolorize::plotImageArray(constructImage(rc_original_pix, rc_obj$centers),
                               main = "Input")
    plot_region()

    # plot new color map & palette
    graphics::par(mar = c(0, 0, 2, 0))
    recolorize::plotImageArray(recoloredImage(rc_obj),
                               main = "Output")
    plot_region()
  }
  return(rc_obj)
}
To demonstrate, let’s take one of the beetle images that come with the package:
img <- system.file("extdata/fulgidissima.png", package = "recolorize")
rc <- recolorize2(img, bins = 3, cutoff = 60, plotting = FALSE)
##
## Using 3^3 = 27 total bins
rc2 <- mergeLayers(rc, list(c(3, 6)), plotting = FALSE)
plot(rc2)
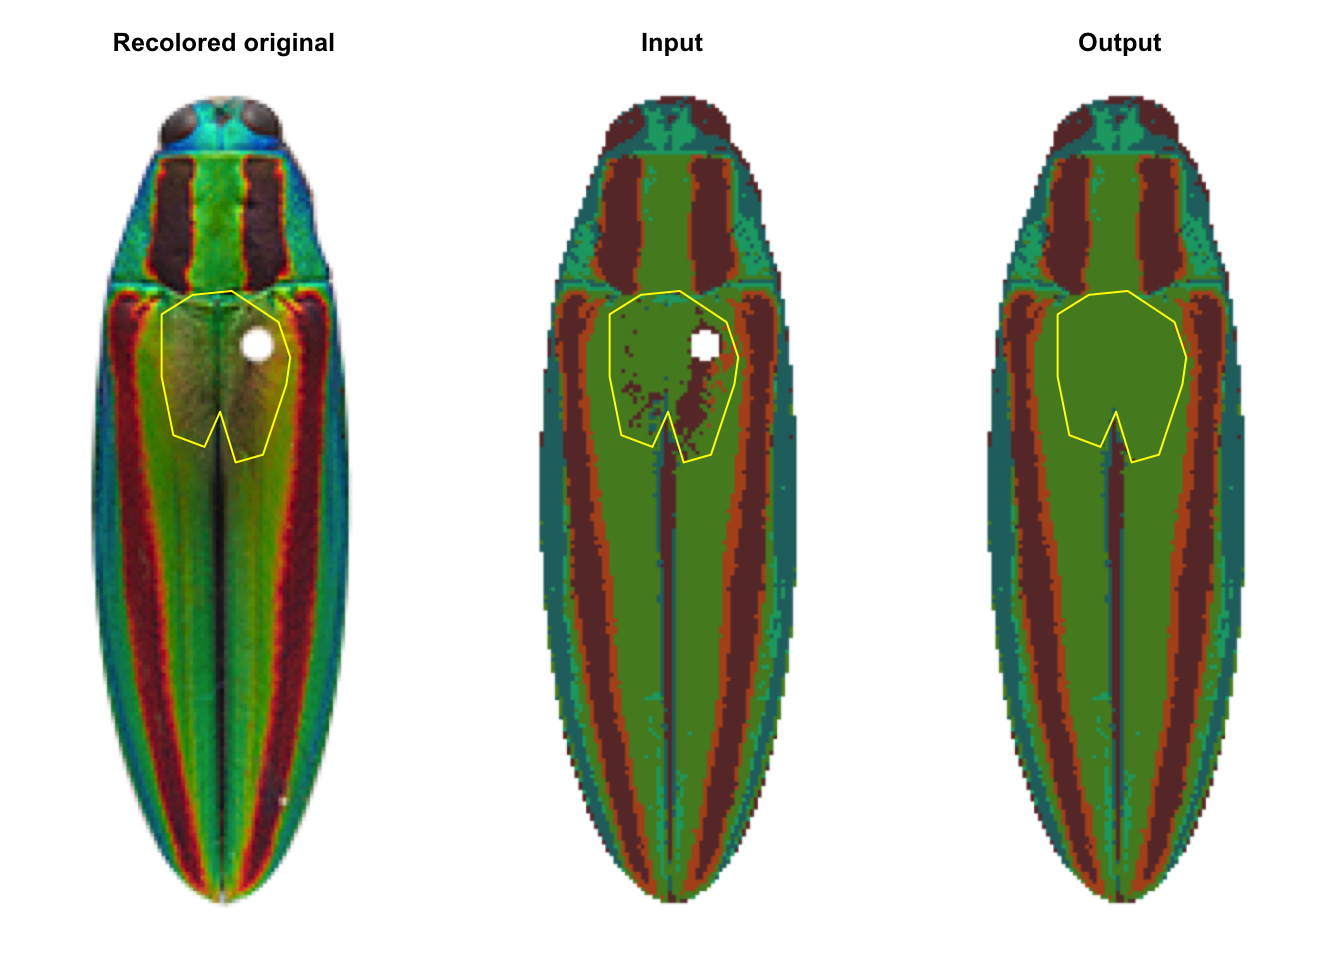
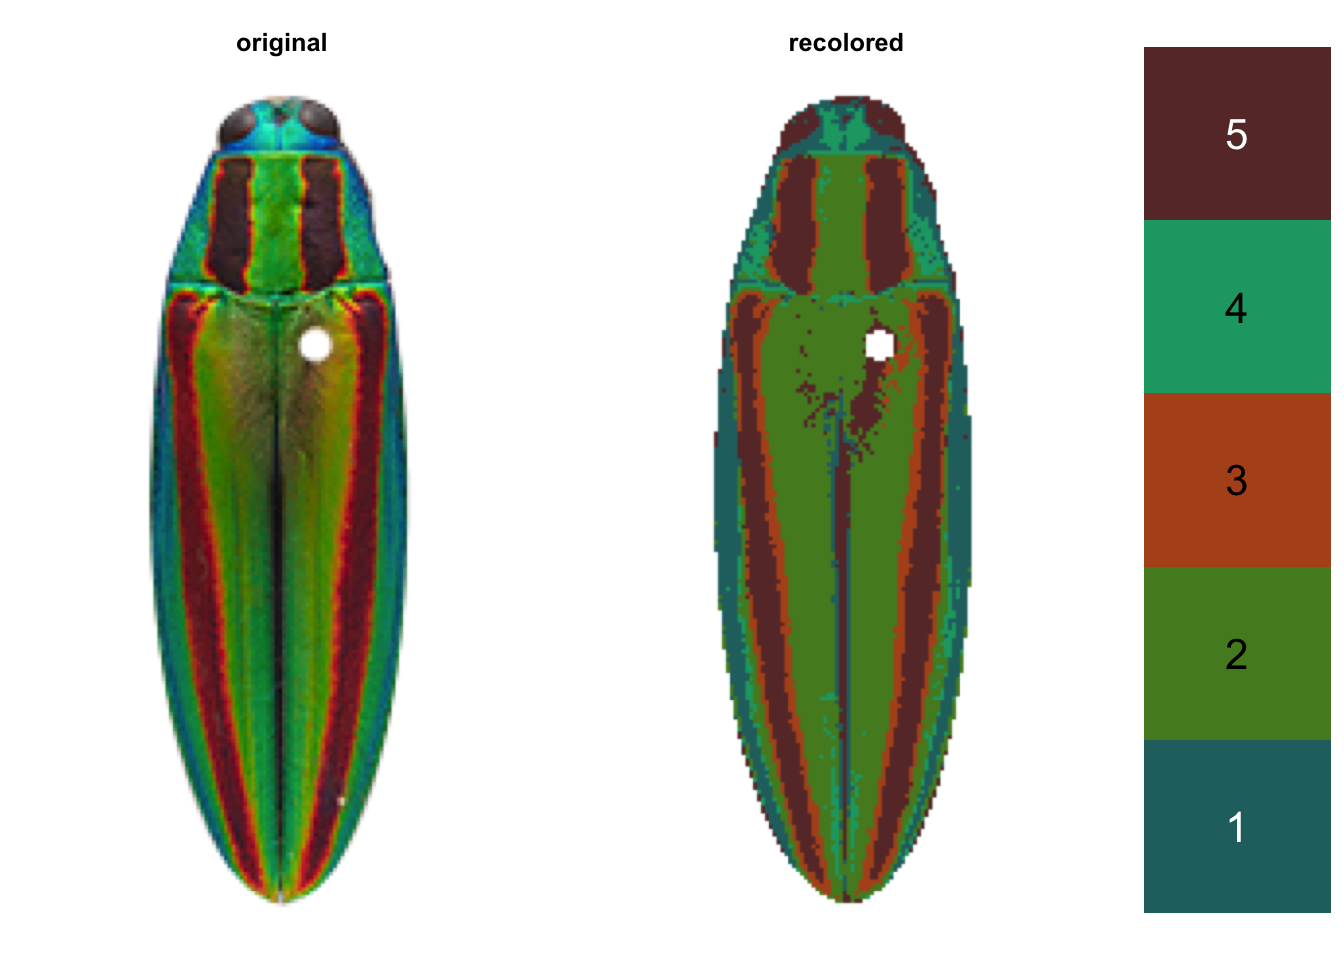 A couple of things bother me in the resulting zone map. These images are of pinned specimens, so when initially processing them, I removed the region of the pin as “background”, leaving this somewhat awkward-looking hole on the right side of the beetle. Second, in real life, apparently that pin created a shadow when the photograph was taken, because we can see it apparently created enough of a shadow that some pixels on that right side got clustered with the dark red/brown color of the bands on the elytra.
We can use the polygon selection option of the recolor_selection function to select that area and force all pixels inside that region to change to color class 2 (green).
rc3 <- recolor_selection(rc2, selection = "polygon", locator_color = "yellow",
                         n_polygons = 1, plotting = TRUE, color_to = 2)
This will pop up a plot of the recolorize object and prompt you to draw a region (in this case, a single polygon). A blog post can’t recreate the user interface aspect where I actually selected a polygon, but here’s a screenshot just before I clicked ‘Finish’:
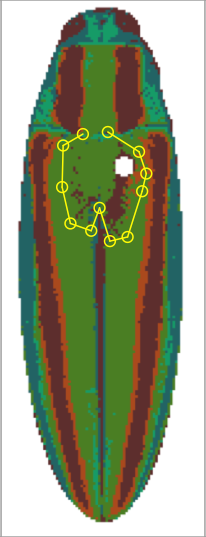
Here, I selected the area around the pin that I want to change to green. (I’m ignoring the groove between the elytra, which is also clustered with class 5; if I were actually trying to analyse this image with respect to a specific biological question I’d have to decide how to handle it, since obviously it doesn’t belong to the same color class as the red bands. But this is an example! I do what I want!)
Then I get a diagnostic plot of the region I recolored:
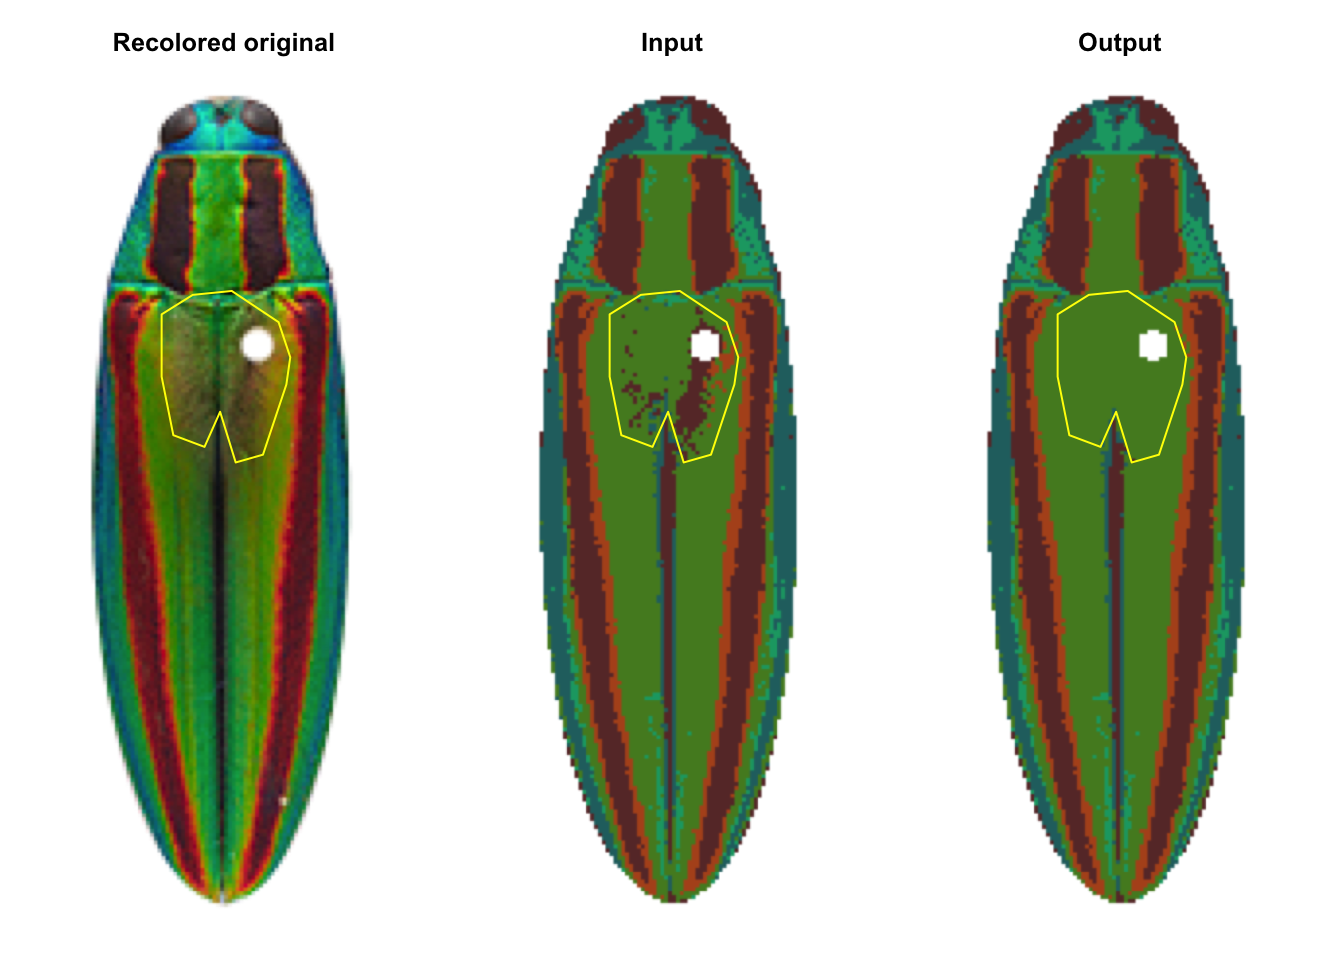
You can see that the pinhole is still present though. That’s the default behavior of the function as I wrote it, since you might be trying to fix something on the border of the image and you don’t want to accidentally color in the background. But you can turn that off by setting recolor_background = TRUE.
rc4 <- recolor_selection(rc2, selection = "polygon", locator_color = "yellow",
                         n_polygons = 1, plotting = TRUE, color_to = 2,
                         recolor_background = TRUE)
Now the pinhole is filled in.
And that’s it! You can use rectangles instead by setting selection = "rectangle", and you can select more than one polygon at a time. This is not currently a formal part of the package because I think it would need way more fine-tuning before that’s feasible (and at that point, I might as well make an R Shiny app). For example, right now this function doesn’t record the changes as part of the call element of a recolorize object, which otherwise records everything that produced it:
# these are different:
print(rc$call)
## recolorize2(img = img, bins = 3, cutoff = 60, plotting = FALSE)
print(rc2$call)
## [[1]]
## recolorize2(img = img, bins = 3, cutoff = 60, plotting = FALSE)
##
## [[2]]
## mergeLayers(recolorize_obj = rc, merge_list = list(c(3, 6)),
##     plotting = FALSE)
# but these are exactly like rc2:
print(rc3$call)
## [[1]]
## recolorize2(img = img, bins = 3, cutoff = 60, plotting = FALSE)
##
## [[2]]
## mergeLayers(recolorize_obj = rc, merge_list = list(c(3, 6)),
##     plotting = FALSE)
print(rc4$call)
## [[1]]
## recolorize2(img = img, bins = 3, cutoff = 60, plotting = FALSE)
##
## [[2]]
## mergeLayers(recolorize_obj = rc, merge_list = list(c(3, 6)),
##     plotting = FALSE)
I don’t necessarily want to build out a whole suite of tools for taking manual input like this. I think that would defeat the purpose of the broader package (to automate what can be automated), and I think it could lead down the unproductive road of me trying to recreate a worse version of ImageJ. But I can definitely appreciate the need for something like this, and hopefully it is useful to multiple people.
If you do use this tool and have some feedback for what else you’d need from it, or if you implement your own solution, please do get in touch. I think this could eventually be a useful addition to the package and feedback is the best way for me to know what’s working and what’s missing.